Main Interface
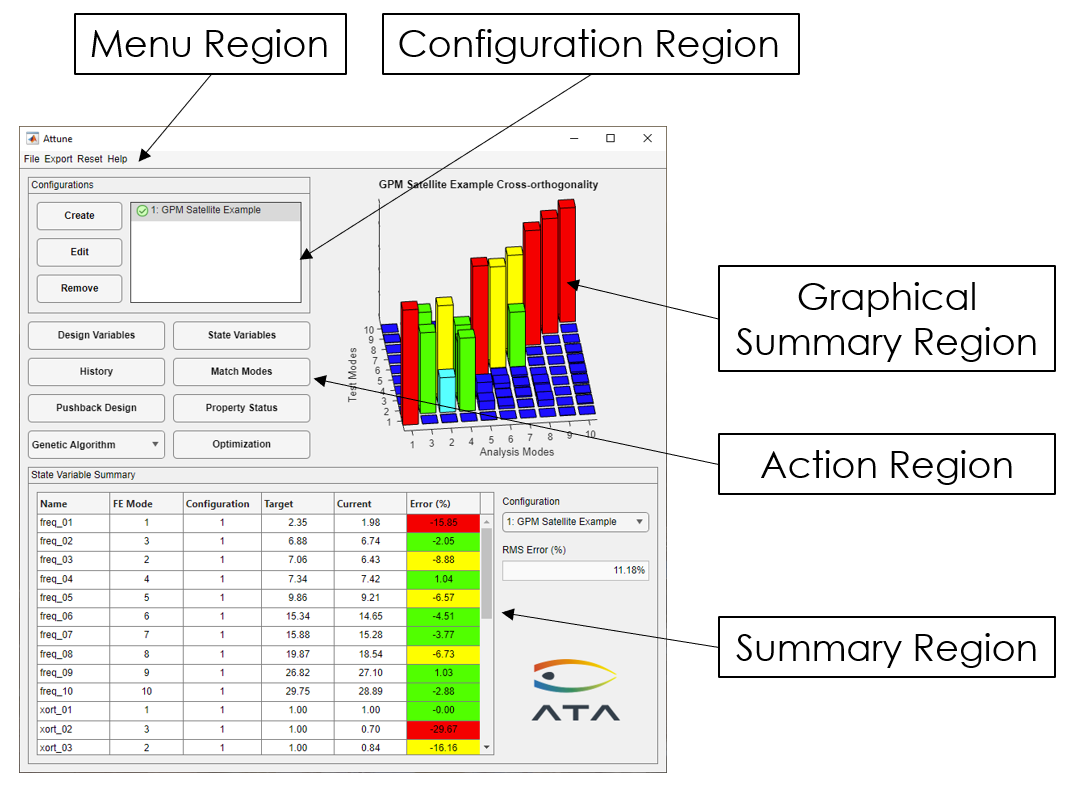
The main Attune window is what is presented when Attune is first opened. It is also the only window that typically remains open throughout the correlation process. The main interface has five distinct functional areas, which are highlighted below.
Main Attune Form
Configuration Region
The configuration region, in the upper left corner, is where the user creates and edits configurations containing the test and analysis data. To create a brand new configuration, press the Create button. This brings up the Configuration Form in a blank state where data can be loaded. To edit a configuration that has already been created, select the desired configuration from the list box and press Edit. The Configuration Form will be loaded and prepopulated with all the data from the selected configuration.
Once a configuration is created/loaded, the name of the configuration is placed in the listbox. There is an icon to left of the configuration’s name that indicates its status. A  indicates the configuration is valid and ready to be correlated. A
  indicates that the configuration does not contain enough data to define the configuration. If there are any configurations that are not valid, many of the buttons and menu items are disabled until this is corrected by editing the configuration. A valid configuration has analysis shapes along with test data or a frequency only definition. The configuration can be in a pre-optimization state (SOL 103) or in an optimization state (SOL 200). This is controlled by using the Active Data Set pull down on the Configuration Form and is discussed in length in that section. As it pertains to the main form, if any of the loaded configurations are in the pre-optimization state, all features related to optimization will be disabled.
If a configuration is no longer needed, valid or not, press the Remove button and the configuration and all its data will be removed from memory.
Summary Region
The status of the correlation is summarized graphically on the axis in the upper-right corner and textually in the summary table below. If more than one configuration is present, the main form can be updated with the information for a particular configuration by selecting the configuration from the pull-down in the Summary region.
The state variables in the summary table are named automatically. The prefix of the name for frequency and shape variables corresponds to the type of variable (e.g., frequency: freq; cross-orthogonality: xort; cross-MAC: xmac). The remainder of the name indicates from which test mode the state variable is derived. For example, freq_1 refers to a frequency state variable that compares test mode 1 to some analysis mode. The analysis mode matching this test mode is identified in the second column of the table (in this case, mode 1). The mass variables are named, intuitively, mass, X_cg, Y_cg, Z_cg, I_xx, I_xy, I_xz, I_yy, I_yz, and I_zz.
Action Region
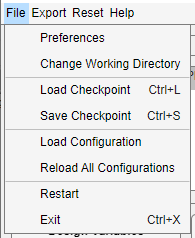
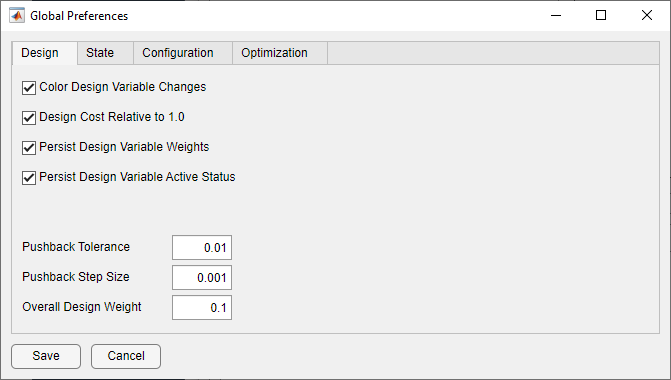
The action region contains all the buttons necessary to call up other forms. The Design Variables and State Variables buttons create (or make active, if they already exist) the Design Variable Form and State Variable Form, respectively. These forms allow the user to manage the design and state variables and are discussed in sections that follow. State variable preferences can be registered as part of the configuration creation and are discussed in the Configuration Form section. Design variable preferences are set on the Global Preferences form available under the “File” menu and are discussed at length below.
The Match Modes button opens the Mode Match Form that permits the user to redefine the mapping between test and analysis modes. This form is discussed later. The Optimization button is tied to the adjacent pull-down list. Clicking this button will create or make active the optimization window corresponding to the method selected in the pull-down. Only one type of optimization window can be open at any time. The optimization forms are discussed in sections to follow. The History button opens the Optimization History Form that allows the user to browse the design space that has been explored in the course of the current Attune session (or may include previous sessions if a checkpoint file was used). The Pushback Design button opens the Pushback Design Form which is a special optimization form used to minimize design variable changes while keeping the integrity of the correlation. The Property Status button opens the Property Status Form used to query the current value of each property and provides a contour plot on the FEM. Both of these forms are discussed in detail later.
