Configuration Form
The Configuration Creation form is used to create new configurations as well as edit existing configurations. The form has five tabs which define its uses.
The Test Tab is used to import test data and to set up mapping and back expansion.
The Analysis Tab is used to load and manage analysis data from the pre-optimization, optimization, and post-optimization versions of the files.
The Mass Tab is used to define the target values for mass state variables.
The Design Tab is used to create and edit design variables before the correlation process begins.
The Preferences Tab is used to define various parameters that control the behavior of the configuration and its correlation.
The top right corner of the form sets the Configuration Type. Attune supports data from Nastran, Abaqus, and Salinas. Changing this pulldown will tailor the configuration, and Attune, to that analysis program. Attune supports correlating multiple configurations at once, but they all must be the same type. If a configuration’s type is changed after data has been loaded, all data will be cleared and the configuration will start from scratch.
Important
It is worth noting that the user should be very careful that the units of the FEM shapes, test shapes, and bulk data are all consistent. If the shapes include rotations, the cross-MAC or cross-orthogonality can have significant errors when inconsistent units are used. Attune does not track units and assumes that any required unit conversion has been done before entering Attune.
In the bottom left corner of the form, the Save button saves the configuration in its current state. If a configuration has been previously saved, it can be saved to a new configuration file by using the Save As button instead. Configurations are not required to have a complete set of data. Incomplete configuration files can be loaded later and will return to the same state as they were left. However, Attune can not proceed without all loaded configurations having a minimum set of test and analysis data. If any configuration is incomplete, the relevant portions of the main form will be disabled until this fixed. As a convenience, the status of each configuration is shown in the list box of the Configuration Region, as discussed in the Main Interface section.
Test Data Tab
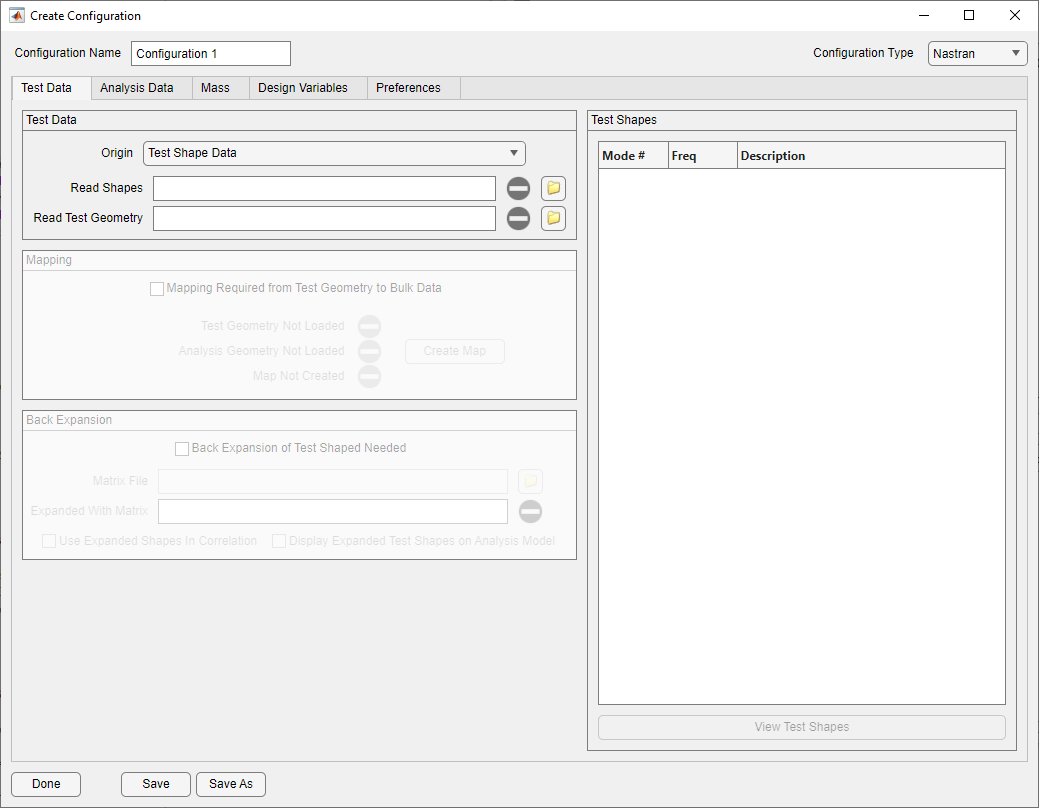
Test Data Tab on Configuration Form
The purpose of the Test Data Tab is to load in test data for the configuration, input any node mapping between the numbering of the test data and the analysis data, and input any back expansion that is desired.
There are two different ways of loading in test data. If test shapes are available, set the Origin pulldown to Test Shape Data and select the load button next to Read Shapes. Available formats for test shape data are Universal (.unv), I-deas shape data (.ash), as well as Nastran OP2 and DMIG. After the file is loaded, the Test Shapes table will be populated with the mode shapes found.
To load in a FEM on which to plot the mode shapes, or to subsequently map the test modes to the analysis modes, select a file using the load button next to Read Test Geometry. Available formats for the test display model are either Nastran bulk data (.dat, .blk, or .bdf), or Universal (.unv).
If only frequencies are available, switch the Origin to Manually Input Frequencies. In this mode, the Key In and Read buttons appear. To input the desired frequencies manually into a table, press Key In. This will bring up the Key In form. On this form, press + to add new rows to the table. On those rows, add the desired test frequencies. If some need to be deleted, select the rows and press the - button. Once the frequencies are entered, press Done and the frequencies will be added to the configuration. If the frequencies are stored in a text file, this file can be selected with the Read button. The expected format is raw text, with one frequency per line.
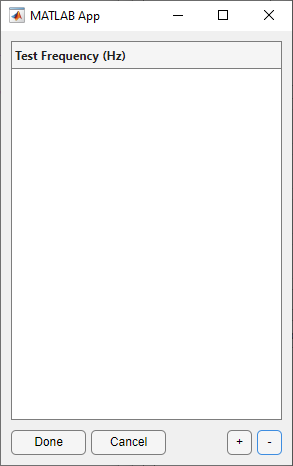
Frequency-Only Key-In Form
It is worth nothing that if a frequency-only configuration is created in this way, the modes must be subsequently matched manually using the Mode Match Form.
When using mode shapes instead of just frequencies, in order for Attune to be able to calculate the cross-orthogonality or cross-MAC, the DOF from the test shapes and analysis shapes must be matched. Ideally, they are already the same. But when they are not, the nodes must be mapped with the node mapping form. Once test shapes have been loaded, the Mapping panel will become active. If mapping is needed, select the checkbox to activate the rest of the panel.
In order for mapping to occur, both test geometry and analysis geometry must be loaded. The status icons on the Mapping Panel indicate whether any of the data is missing. Once it has been loaded, the Create Map button will be activated. To open the form, press the button. The node mapping form is discussed in detail below, but once the map is complete, a checkmark will appear next to Map Created. If, at any point, the map is no longer needed, unselect the checkbox in the Mapping Panel.
If back expansion of the test shapes is desired, check the Back Expansion of Test Shapes Needed checkbox after loading in test shapes. This will activate the rest of the panel. To load the file containing the back-expansion matrix, select the load button next to Matrix File. The available types are either Nastran punch or op2. Once the file is selected, a subsequent dialog will appear where the back-expansion matrix can be selected from all the other matrices found in the file. Once that is selected, the test modes will be expanded assuming the DOF line up correctly. To use the expanded shapes during the correlation, select Use Expanded Shapes in Correlation. If the expanded shapes should be plotted on the Analysis Display Model instead of the Test Display Model, check Display Expanded Test Shapes on Analysis Model. If the back expansion is no longer needed, unselect Back Expansion of Test Shapes Needed and the back expansion will be cleared.
Node Mapping Form
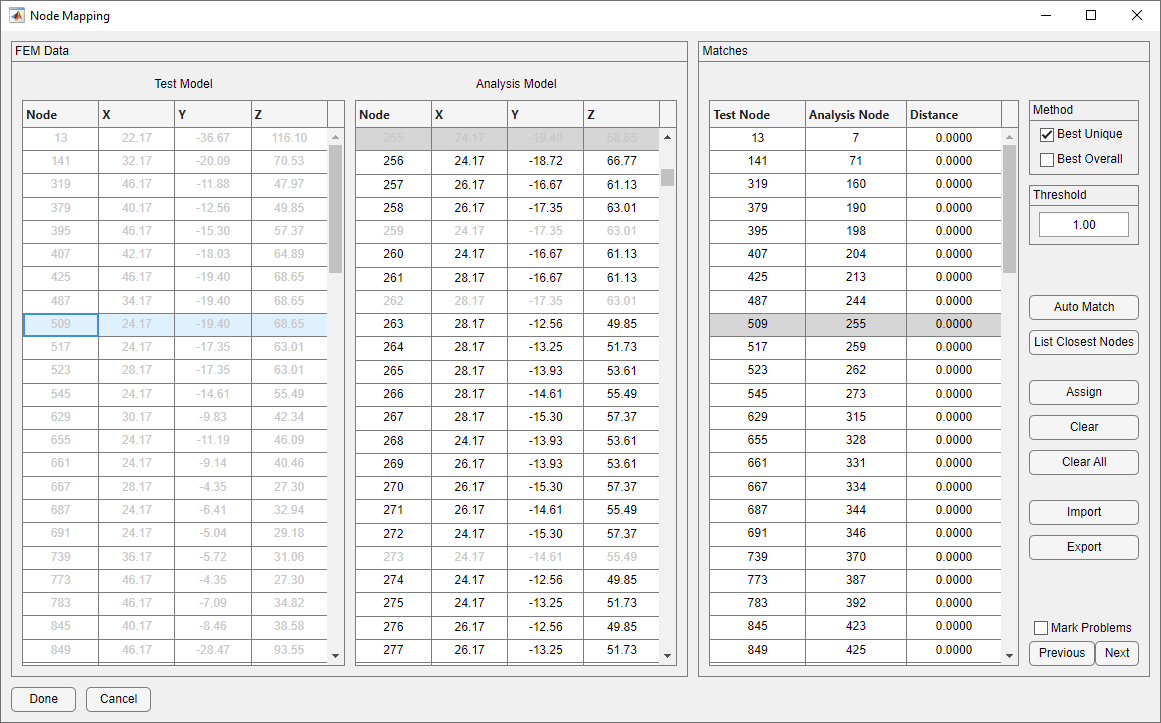
Node Mapping Form
The purpose of the Node Mapping form is to create a relation between test geometry and analysis geometry in the common case where the test nodes do not have corresponding, identically numbered nodes in the analysis model. It is critical to note that this is a mapping of nodes only. DOF are not reordered, nor are coordinate transformations applied. When the Node Mapping form is initially opened, the Test Model table and the Analysis Model table in the FEM data panel will be populated with nodes of the test model as loaded from the Read Test Geometry section, and the analysis model shown in the Analysis Display Model. By default, the analysis display model is the same as the bulk data.
The easiest way to create a node map is to press the Auto Match button. This button will generate matches based on the threshold and method that are selected at the top of the form. The Threshold controls the maximum distance between two nodes that will be considered for a match. The Method panel controls whether the Best Unique or Best Overall node match will be considered when automatically making matches. Matches can also be manually made by selecting a node from the Test Model table and a node from the Analysis Model table and pressing the Assign button. After the button is pressed, the match will be added to the Matches table. A previously defined match can be removed by selecting the desired match in the Matches table and pressing Clear. All matches can be removed by pressing the Clear All button. Nodes that have been matched will be grayed out in the Test Model and Analysis Model tables.
In the case that Auto Match cannot match all of the test nodes, checking the Mark Problems checkbox will turn red all rows of the Matches table corresponding to unmatched nodes. This list of problematic matches can be navigated by pressing the Previous or Next buttons below the checkbox. This will automatically navigate the table to the next or previous problematic match. If no problematic matches exist and all test nodes are mapped, then a dialog box will appear confirming this.
To manually find the best match for a particular test node, select the desired test node and press List Closest Nodes. This form lists the ten closest nodes to the selected test node. Marking a checkbox on the table and pressing Save will assign that match and update the Matches table. Analysis nodes that already have a match will be grayed out. Selecting any of these nodes will update the current match and remove the previously defined match for that analysis node if the match method is currently Best Unique.
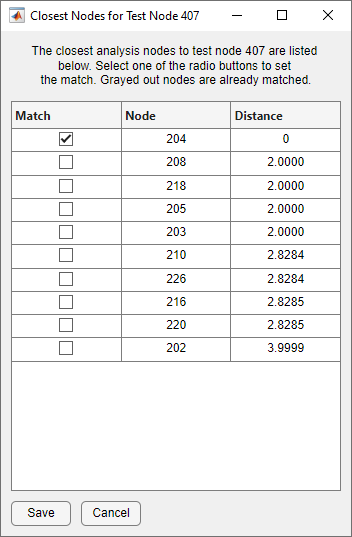
Closest Node Dialog on Node Mapping Form
The node map can be saved by pressing the Save button. If all nodes are not matched, a dialog box will appear asking if the test shapes should be truncated. If they should be truncated, the DOF corresponding to the unmatched nodes will be removed from the shape.
After the node map has been saved, the form will close and a check mark will appear next to Map Created indicating that the map is active. If the map needs to be edited, pressing Create Map again on the configuration form will return to the Node Mapping form with the map preloaded.
An alternative capability to the automatic node mapping is provided by the Import button. The user can specify the node mapping directly in a text file. This option could be especially important if the test nodes may map to coincident nodes in the analytical model. The file should contain two columns of numbers separated by commas. The first column contains the test node ID. The second column contains the corresponding analysis node ID. There must not be duplicate copies of any test node ID. If the map does not include all of the test nodes, the user will be prompted if they want to continue. If so, the test shapes will be truncated to the nodes listed in the file.
After the node mapping has been set, the user can save the mapping to a text file using the Export button. The mapping will be saved as a comma-delimited text file with two columns: test node IDs and analysis node IDs. The user will be provided with a file selection window to choose the name and location of the file.
Analysis Data Tab
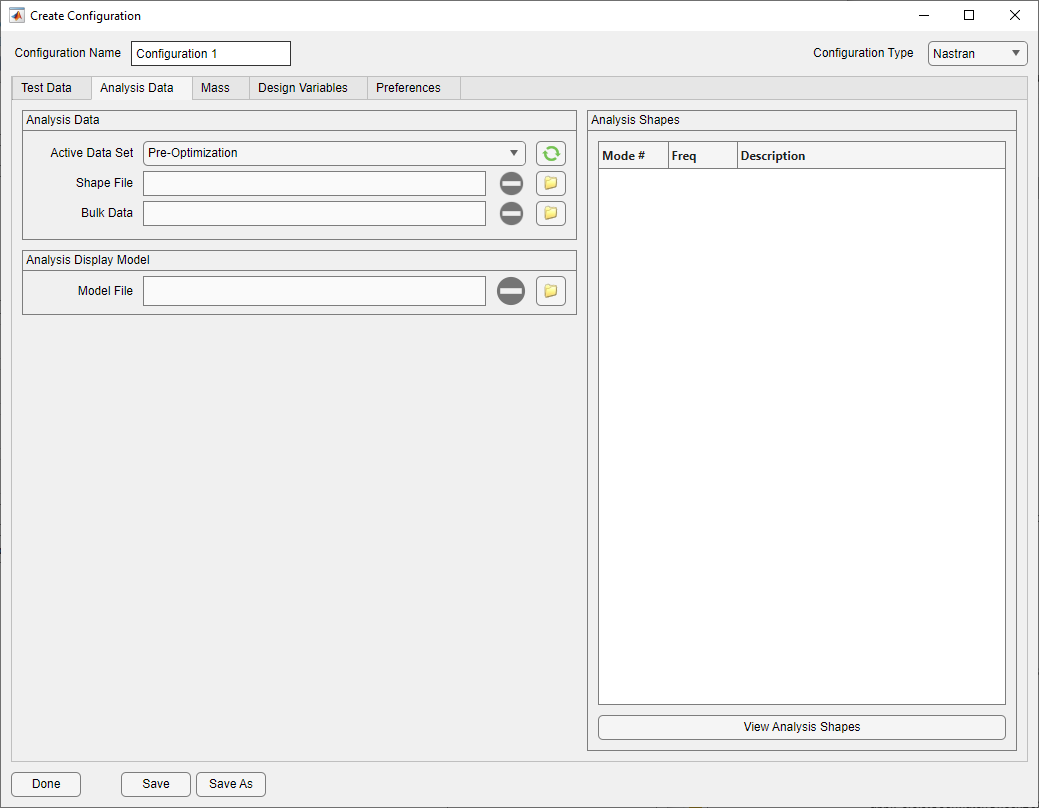
Analysis Data Tab on Configuration Form
The purpose of the Analysis Data Tab is to load analysis data into the configuration. Attune tracks the full life cycle of the analysis data during the correlation process, as it goes from Pre-Optimization (a normal modes run, SOL 103) to Optimization (SOL 200), which is what Attune uses to correlate with, and finally to Post-Optimization (SOL 103) after the design has been updated with the final property values calculated from Attune.
This life cycle is tracked with the Active Data Set pulldown. It allows Attune to switch between which analysis file is currently active for the configuration. If the active data set is set to Pre-Optimization or Post-Optimization, only a subset of the main form will be available as there will be no design sensitivities to work with. When it is set to Optimization with the requisite data loaded, all of the buttons on the main Attune window will be active.
When starting with an analysis file that is SOL 103, with no design variables created, load data in when the Active Data Set is set to Pre-Optimization. Create design variables, export with Write SOL 200, solve, and then import back into the Optimization slot of the active data set to begin the correlation process.
When the configuration type is set to Salinas or Abaqus, the configuration is automatically set to Optimization as this life-cycle functionality is unable to be performed with these solvers.
No matter what Active Data Set is selected, data is loaded using the folder icon next to either Shape File or Bulk Data. When a shape file is selected from the file import dialog, a subsequent dialog will appear to ask where the bulk data can be found. If the file name is the same as the shape data, that file will be offered. Otherwise, a different file can be selected, or no file at all. For an optimization, bulk data is not required; however, the design variables will not be able to be editted on the Design Tab. The bulk data will also not automatically appear when writing the Final Design to Bulk, but the file can be selected manually there later. Analysis mode shapes will also not be able to be plotted in any part of Attune without the bulk data, or a file loaded in the Analysis Display Model.
The Analysis Display Model is a separate model from the bulk data on which to plot the mode shapes. By default, it is the same as the bulk data, but it can be changed later to a different model.
Once shape data and bulk data (or an Analysis Display Model) have been loaded, the mode shapes can be viewed by selecting a row from the table and pressing View Analysis Shapes. This will bring up a separate plot window with the mode shape.
Mass Tab
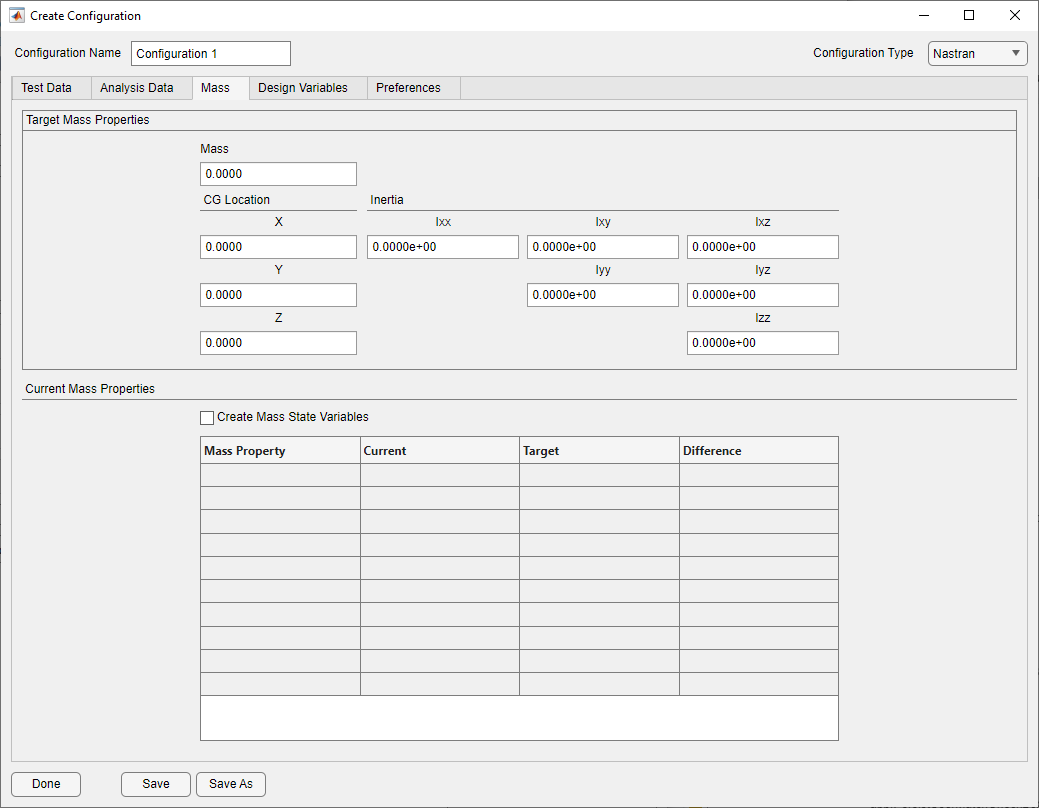
Mass Tab on Configuration Form
The Mass tab is populated when the rigid body mass properties are available from the analysis data read in. The user may set the target values using the edit boxes on the Target Mass Properties panel. The table at the bottom of the form summarizes the current status of the rigid body mass properties with respect to the target values. State variables for the mass properties will automatically be created when the rigid body mass properties are available. If this is not desired, uncheck the Create Mass State Variables checkbox.
Design Variables Tab
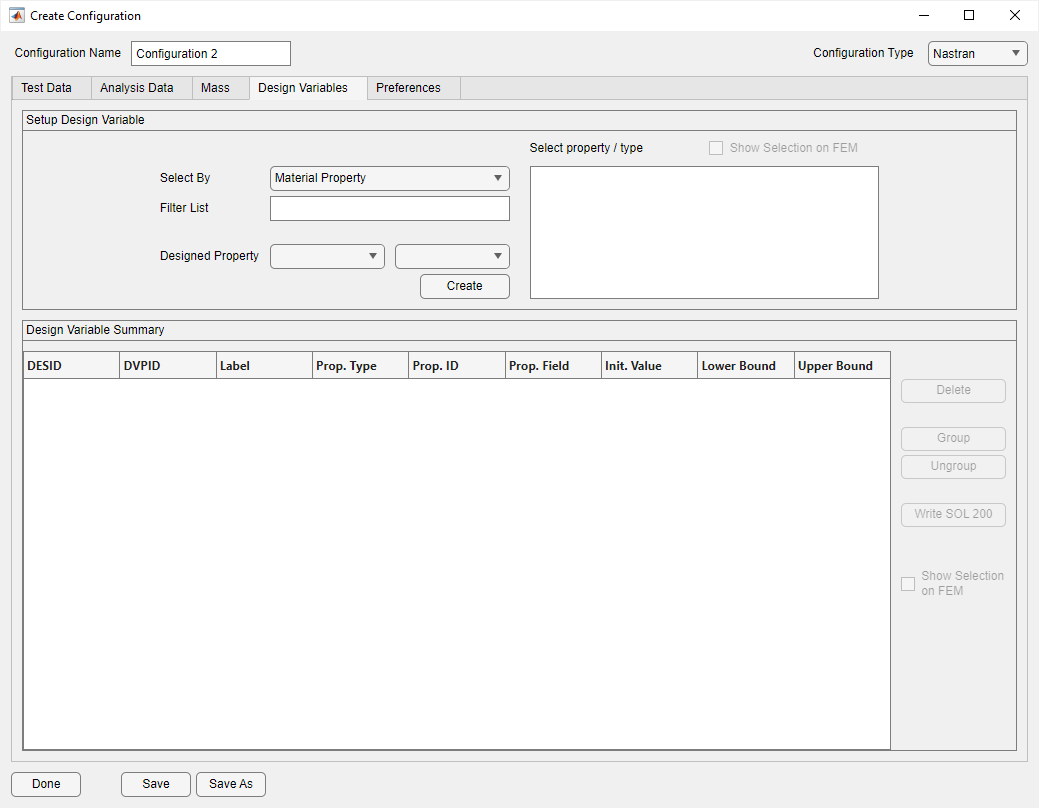
Design Variables Tab on Configuration Form
The purpose of the Design Variables tab is to either create design variables from a previously import SOL 103 deck, or to modify or add design variables to a SOL 200. It is only available when the configuration is set to Nastran. It does not affect any sensitivity data that was read in - it is meant as a utilility for generating or modifying the SOL 200 data. The changes made on this tab have no impact until the modified deck is written out, solved, and reimported.
The Design tab consists of two regions: the Setup Design Variable region and the Design Variable Summary region.
Design variables are created in the Setup Design Variable region. Selecting an item in the Select By pulldown will change the mode of the region. There are three modes for creating design variables: Material Property, Physical Property, and Element Type. Each mode is described in detail below. A complete list of designable properties is shown in the appendix.
Material Property: Selecting by material property populates the listbox with all supported material cards that were found in the bulk data. The listbox will display both the material type and the material ID number. An additional entry for each material card type is labeled with the “All” ID, allowing users to create variables for all ids of that material card type. This list can be further filtered by entering a desired pattern into the Filter List edit box. Selecting a material from the listbox will populate the left popup of Designed Property with the selection. The right popup will contain the designable fields of the selected material as well as an “All” entry for creating all of the designable properties at once. Pressing Create will create the design variable(s) and add it to the Design Variable Summary table.
Physical Property: Selecting by physical property works similarly to selecting by material. Selecting by physical property populates the listbox with all supported physical property cards that were found in the bulk data with an added “All” entry for each type. CELAS2 and CONM2 elements appear in this mode also, with the ID in parentheses being the ID of the element to be designed. Each property will be listed individually and the listbox will display both the property type and the property ID number. This list can be further filtered by entering a desired pattern into the Filter List edit box. Selecting a property from the listbox will populate the Designed Property popups with the selection. The left popup will contain the selected property. The right popup will contain the designable fields of the selection in the left popup as well as an “All” entry for creating all of the designable properties at once. Pressing Create will create the design variable(s) and add it to the Design Variable Summary table.
Element Type: Selecting by element type will populate the listbox with all of the supported property types that were found in the bulk data. This mode is different from “Physical Property” in that it lists the properties by type only, not individually by property label. The individual properties are then listed in the left popup when a property type is selected from the listbox. The right popup then contains all the designable fields for that property. Pressing Create will create the design variable(s) and add it to the Design Variable Summary table.
The Design Variable Summary table lists all of the design variables for the current configuration. Design variables that were loaded from bulk, as well as those that were created by the user, are displayed in the table. From the table, the design variable ID (DESID), design variable property relation ID (DVPID), label, initial value, lower bound, and upper bound can be modified by changing the value directly in the table. If a value entered into a cell of the table is invalid, an error message will appear, and the cell will return to its previous value.
Each line of the Design Variable Summary table corresponds to a Nastran DVPREL1/DVMREL1/DVCREL1 card. If there is a one-to-one relationship between the property relation and the design variable, the number of rows will correspond to the number of design variables as well. However, it is possible that multiple relations point to the same design variable. Because of this, the DVPID must be unique, while the DESID may not be. A non-unique DESID indicates that the relations are linked to the same design variable. These “groups” of design variables can be created by selecting a number of design variables from the table and pressing the Group button. The DESID and label will be changed so that all of the selected entries are identical. Conversely, previously grouped design variables can be ungrouped by selecting the group and pressing Ungroup. In this case, unique DESIDs and labels will be assigned to the design variables.
Changing the DESID or label of a member of a group of design variables will cause all of the DESIDs and labels of that group to be changed. Also, selecting a member of the group will cause all other members of the group to be highlighted. The editable fields are described in more detail below:
DESID: DESID controls the DESVAR ID that the DV*REL is pointing to. If it is changed, the ID of all other DV*RELs that are pointing to it will change as well. After a change is made, the table will be reordered so that the DESIDs are always numerically increasing.
DVPID: DVPID controls the DV*REL ID. It must be unique to the configuration.
Label: The label behaves much like the DESID. It is the label that is placed on the DESVAR card.
Prop Type: This points to what property or material card is associated with the DV*REL card.
Prop ID: This points to the PID or MID of the Prop Type**
Prop Field: The prop field is the field of the property or material that is being designed.
Initial Value: The initial value is the initial value of the property that the DV*REL is related to. Specifically, it corresponds to the coefficient of linear relation as defined on the card. In terms of Attune, this matches the initial value of the property the design variable points to.
Upper Bound and Lower Bound: The upper and lower bounds correspond to the bounds on the DESVAR card. It is important to recognize that these are the design variable bounds and not the property bounds.
Any design variable can be deleted by selecting it in the table and then selecting the Delete button. If an existing design variable for the bulk is deleted, it will be commented out in the bulk data.
If Show Selection on FEM is selected in the Setup Design Variable or Design Variable Summary regions, whenever an item is selected from the list box or table in these regions, the corresponding elements the selection pertains to will be highlighted on the FEM. If the FEM has not been plotted, then it will be created. If the FEM plot is closed, and the checkbox is still checked, the FEM plot window will be created the next time the selection is changed.
As mentioned earlier, the addition or deletion of design variables is limited to this tab until the Write SOL 200 button is pressed. This will bring up a dialog to select a new filename to write the updated SOL 200 deck to. If the Active Data Set is set to Pre-Optimization, then any additional lines that are needed to run Attune will be added to the deck as well. The user will be prompted to input a string (default is “_200”) to insert into the filename of any files requiring changes. All INCLUDE statements will be updated to reflect the new filename.
After the new/updated SOL 200 deck is written out, it needs to be solved and reimported into Attune using the method described in the Analysis Data Tab Section. Namely, the Active Data Set must be changed to Optimization and the shape file selected with the load button. This will load the updated data into Attune and place it in the Optimization slot of the configuration.
Preferences Tab
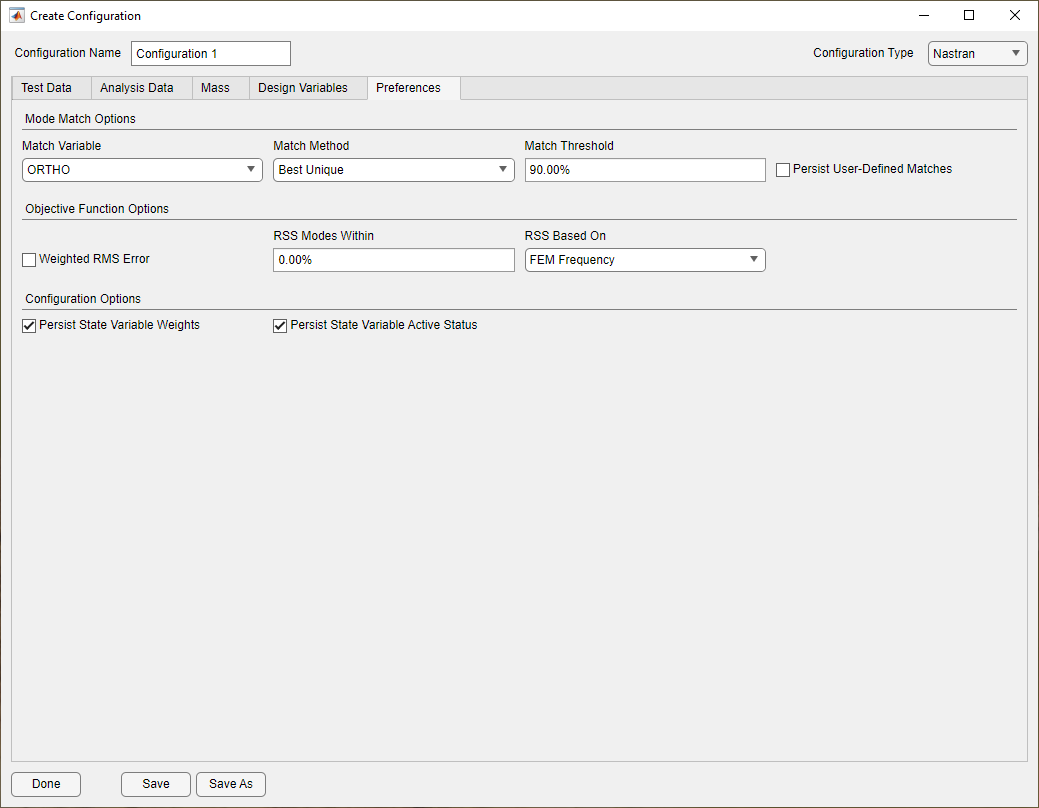
Preferences Tab on Configuration Form
The Preferences tab contains settings that control the default behavior of the configuration throughout Attune. The settings are broken down into three groups: Mode Match Options, Objective Function Options, and Configuration Options, which are described in detail below.
Match Variable: The match variable controls the metric by which mode matches are made and shape fidelity is measured: cross-orthogonality (ORTHO), cross-MAC (MAC), or frequency-only. Cross-orthogonality is only available if a reduced-mass matrix of the analytical model was imported with the analysis data. If the reduced-mass matrix is not provided, the cross-orthogonality selection will not be available in the pulldown. Selecting frequency-only as the match variable will force the correlation to use only the frequency data.
Match Method: The match method controls the behavior of automatic matching. “Best Overall Match” will pick the best match for each target mode, while “Best Unique Match” will do the same, but force each target mode to match a unique analysis mode.
Match Threshold: The match threshold changes the threshold for the maximum shape error that will be considered for a match. If a target mode does not have a match within the threshold, it will remain unmatched. This setting is affected by the preference set on the Global Preference form that controls whether the threshold is applied during optimization. See the section on global preferences for a more in-depth discussion regarding this. The threshold is never applied to user-defined matches.
Persist User-Defined Matches: This checkbox controls whether user-defined matches, if created by the user, are written to a file so that the matches can be persisted between Attune sessions, even if the analysis modes change due to model updating.
Weighted RMS Error: This toggle controls whether the weighting values on the State Variable form will be included in the RMS error calculation.
RSS Modes Within: This edit box controls the frequency percentage of each mode that RSS will be applied to. If “100” is entered in the edit box, RSS will be applied over all the modes.
RSS Based On: This pulldown controls whether the frequency range over which to apply RSS will be based on the test or the FEM frequency.
Persist State Variable Weights: This check box controls whether state variable weights will be persisted between Attune sessions. The weights are stored in the configuration file, and are applied when the configuration is reloaded. If, when the configuration is reloaded, more state variables exist than were stored in the configuration file, the weights will be applied in order, with all unexpected state variables’ weights set as 1.0. If fewer state variables exist than were stored in the configuration file, the weights will be applied in order, with all extra weights discarded.
Persist State Variable Active Status: This check box controls whether state variable active status will be persisted between Attune sessions. The active statuses are stored in the configuration file, and are applied when the configuration is reloaded. If, when the configuration is reloaded, more state variables exist than were stored in the configuration file, the active statuses will be applied in order, with all unexpected state variables being set as active. If fewer state variables exist than were stored in the configuration file, the active statuses will be applied in order, with all extra discarded.